Troubleshooting
Elasticsearch
Request Entity Too Large
The remote server returned an error: (413) Request Entity Too Large.
This error occurs during Indexing if a too large "bulkSizeDocument" value have been set or if the archive contains many large files.
The following two configuration changes should be done:
- Stop
inPoint.Indexer,Elasticsearch-KibanaandElasticsearchservice. - Browse to the
configfolder from Elasticsearch and open theelasticsearch.yml.
Add this line:The default value forhttp.max_content_length: 500MBmax_content_lengthis100MB.
The maximum value is2GB, as this is the hard limit of the Lucene Index.
Detailed description see: Elasticsearch HTTP settings - Browse to the Indexer installation folder and open the
inPoint.Indexer.exe.configfile.
Reduce the value forbulkSizeDocument.
Example:bulkSizeDocument="50" - Start
Elasticsearch,Elasticsearch-KibanaandinPoint.Indexerservice.
ElasticSearch uses all available RAM
The amount of RAM used by ElasticSearch itself can be configured in 'jvm.options' (see Java heap space). Elasticsearch uses memory mapped files for accessing the index. This data is cached by the file system cache, the cache will release memory if needed by other applications but in the meantime it can look if all memory is used. The task manager will not show it in the memory column of the Elasticsearch process, but the number of total available memory will decrease. With RAMMap from Microsoft you can see all details.
The problem is that some applications will cease working if not enough memory appears to be free (e.g. Internet Information Services (IIS) stops when less of 5% of total memory is free).
Configure the file system cache
To limit the amount of memory taken by the file system cache you can use the script FileSystemCache.ps1 included in the inPoint Tools. These settings are not persisted and will be reset on a reboot.
Usage: Open a commandline with full admin rights:
For accssing the help call without any parameter
powershell -file .\FileSystemCache.ps1
Read current settings
Gets the current settings and displays them.
powershell -file .\FileSystemCache.ps1 -get
Flush the cache
Flushes the file system cache (all used data will be emptied).
powershell -file .\FileSystemCache.ps1 -flush
Configure the maximum cache size
Sets the maximum size of the file cache, allowed values can have a percent of the total memory or an absolut number given in GB, MB, KB or B.
powershell -file .\FileSystemCache.ps1 -set 10GB
Clear the cache settings
Clears the settings of the file system cache
powershell -file .\FileSystemCache.ps1 -clear
Java heap space
If Elasticsearch crashes while indexing and the errors in the title appear in the Elasticsearch log, it probably has the following reason:
Elasticsearch was left at the default RAM value (2GB), the value for http.max_content_length was increased and/or the indexer was set to multiple workers.
To be able to process any index request, Elasticsearch must hold it in memory for a short time before writing it down to the files. This is the normal behavior and if too many request are incoming or the size is to high, it runs out of memory and crashes.
Example: http.max_content_length was set to 500MB and the Indexer is configured to run with 6 workers. Then we recommend to use Elasticsearch with 6GB Memory.
The formula is: http.max_content_length * Count Indexer workers * 2
Please check the install documentation to set the available Memory for Elasticsearch.
fatal error on the network layer
See: Java heap space
Fails to start due to 'Direct buffer memory' error
If the service does not start with a message Exception in thread "main" java.lang.OutOfMemoryError: Direct buffer memory, it's possible to set the value manually.
Avoid using a multiple of 4gb for the direct buffer memory. This value is per default the half of the -Xmx setting.
If -Xmx8gb is used, then direct buffer memory would be 4g (or 4096m), avoid this by using 4095m instead by setting --XX:MaxDirectMemorySize=4095m explicitly.
To set the direct buffer memory for Elasticsearch:
- Stop
inPoint.Indexer,Elasticsearch-KibanaandElasticsearchservice - Browse to the
configfolder from Elasticsearch and open thejvm.options.
Set the required Values in MB for the key--XX:MaxDirectMemorySize=4095m - Start
Elasticsearch,Elasticsearch-KibanaandinPoint.Indexerservice
index read only
WriteItemToIndex: Type: cluster_block_exception Reason: "blocked by: [FORBIDDEN/12/index read-only / allow delete (api)];"
See: FORBIDDEN/12/index read-only / allow delete (api)
The error shown in the title occurs when Elasticsearch detects that not enough disk space is available.
Follow this Steps to fix this error:
- Stop
inPoint.Indexer,Elasticsearch-KibanaandElasticsearchservice - Increase the disk space or delete unnecessary files
- Start
ElasticsearchandElasticsearch-Kibanaservice - Execute this command in the Kibana Dev Tools Console:
If Kibana cannot be used, execute this command using PowerShell:
PUT */_settings
{
    "index": {
	    "blocks": {
		    "read_only_allow_delete": "false"
	    }
    }
}$body = @"
{
"index.blocks.read_only_allow_delete": null
}
"@
Invoke-RestMethod -Method Put -Uri "http://<host>:9200/_settings" -Body $body -ContentType "Application/json" - Start
inPoint.Indexerservice
Big hprof Files in system32 folder
Whenever Elasticsearch crashes and still manages to write a dump, this dump ends up as a .hprof file under C:\Windows\System32. These files can be deleted safely.
See: Large size of .hprof files on data nodes
To disable writing dumps on out of Memory Errors, browse to the Elasticsearch config folder and open the jvm.options file. Remove the line -XX:+HeapDumpOnOutOfMemoryError and then restart Elasticsearch service.
If the dump's should be still written but to a different directory, add this line -XX:HeapDumpPath=<path> to the jvm.options file.
See: JVM heap dump path
Find config, data and logs folder
How to find the three Elasticsearch folder config, data and logs?
First of all the path for the config folder must be found. Open the Environment Variables and under the System Variables search for the ES_PATH_CONF variable. The value of this variable is the path to the config folder.
Browse to the config folder and open the elasticsearch.yml file. In this file there are two keys named path.data and path.logs, the values for this keys are the paths to the data and logs folder.
Elasticsearch services does not start anymore
Make sure that OpenJDK 17 64Bit is installed correctly!
See: OpenJDK 17 Installation
See also: Server Requirements Software
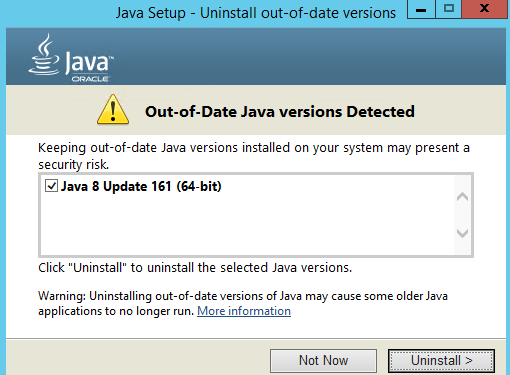
Check if any Oracle Java is installed, if yes then uninstall all of them!
The following scenario we had already at some customers:
inPoint Server 2018.1 was installed with Elasticsearch. During this installation also Java 8 161 64Bit was installed and then Elasticsearch works fine.
If Axon.ivy is installed afterwards, started up and then the Admin website is opened. You will be informed that a newer Java version is available and if you want to install it.
Clicking on the link will download the latest Java 8 version in 32Bit. This must then be installed manually, at the end of the Java installation an "Out-of-Date Java versions Detected" window in which the older Java 8 64Bit version is listed (and also selected for uninstalling). If you simply click on "Uninstall" this required Java version will be removed and Elasticsearch will not start anymore!
Axon.ivy and Elasticsearch on the same Server
Axon.ivy has also integrated an Elasticsearch server which runs on the same ports as our installed Elasticsearch server.
Change the Elasticsearch server from Axon.ivy to run on another port.
Browse to the Axon.ivy Engine directory (AxonIvyEngine10.0.3.2301121444_Windows_x64) and then browse to the Elasticsearch config folder (elasticsearch\config). Open the elasticsearch.yml and add this two lines:
http.port: 9205
transport.tcp.port: 9305
Then browse to the Elasticsearch bin folder (elasticsearch\bin) and open the elasticsearch.bat.
After line 6 add this two lines:
SET ES_HOME=
SET ES_PATH_CONF=
Restart the Axon.ivy Engine.
Attention: The Axon.ivy Designer does also contain an Elasticsearch server!
Accessing a search result after the 10.000 item limit
Error Result window is too large
Per default ElasticSearch only allows access to the first 10.000 rows of a result. E.g. if the page size is 100, it's only possible to access the pages from 0 to 99.
This is a safeguard, because it's not possible to actually skip pages, but the results are internally always read from the start, but not returned to the client. So a further page is a little slower and requires more memory than the previous one.
The recommended way to deal with this, is to redefine the search or change the sort order of the query. It's still possible to change this limit, create or change the setting index.max_result_window for the index.
Reading the current value (change the name of the index).
GET /inpoint/_settings/index.max_result_window?pretty
If the result is empty, the default of 10.000 is in use.
Writing a new value (change the name of the index). To use the default again, use "null" as value (without the quotation marks)
PUT /inpoint/_settings
{
"index.max_result_window" : 15000
}
If you need to increase this, because you want to export or dump the whole result. Please have a look at the ElasticSearch documentation (Search After or Scroll) for the correct way to deal with this.
Database
Helpful SQL Queries
--New Entries added to IP_FULLTEXT per Day
SELECT convert(VARCHAR(10), REQUEST_DATE, 120) AS 'YYYY-MM-DD'
	,count(*) AS 'COUNT'
FROM pam.IP_FULLTEXT WITH (NOLOCK)
GROUP BY convert(VARCHAR(10), REQUEST_DATE, 120)
ORDER BY 1 DESC
--New Entries added to IP_FULLTEXT per Hour
SELECT convert(VARCHAR(13), REQUEST_DATE, 120) AS 'YYYY-MM-DD hh'
	,count(*) AS 'COUNT'
FROM pam.IP_FULLTEXT WITH (NOLOCK)
GROUP BY convert(VARCHAR(13), REQUEST_DATE, 120)
ORDER BY 1 DESC
--New Entries added to IP_FULLTEXT per Minute
SELECT convert(VARCHAR(16), REQUEST_DATE, 120) AS 'YYYY-MM-DD hh:mm'
	,count(*) AS 'COUNT'
FROM pam.IP_FULLTEXT WITH (NOLOCK)
GROUP BY convert(VARCHAR(16), REQUEST_DATE, 120)
ORDER BY 1 DESC
--Indexed Entries per Day
SELECT convert(VARCHAR(10), INDEXED_ON, 120) AS 'YYYY-MM-DD'
	,count(*) AS 'COUNT'
FROM pam.IP_FULLTEXT_QUEUE WITH (NOLOCK)
GROUP BY convert(VARCHAR(10), INDEXED_ON, 120)
ORDER BY 1 DESC
--Indexed Entries per Hour
SELECT convert(VARCHAR(13), INDEXED_ON, 120) AS 'YYYY-MM-DD hh'
	,count(*) AS 'COUNT'
FROM pam.IP_FULLTEXT_QUEUE WITH (NOLOCK)
GROUP BY convert(VARCHAR(13), INDEXED_ON, 120)
ORDER BY 1 DESC
--Indexed Entries per Minute
SELECT convert(VARCHAR(16), INDEXED_ON, 120) AS 'YYYY-MM-DD hh:mm'
	,count(*) AS 'COUNT'
FROM pam.IP_FULLTEXT_QUEUE WITH (NOLOCK)
GROUP BY convert(VARCHAR(16), INDEXED_ON, 120)
ORDER BY 1 DESC
--All Entries from IP_FULLTEXT grouped by Status
SELECT STATUS
	,count(*) AS 'COUNT'
FROM pam.IP_FULLTEXT WITH (NOLOCK)
GROUP BY STATUS
ORDER BY 1 ASC
--All Entries from IP_FULLTEXT_QUEUE grouped by Status
SELECT STATUS
	,count(*) AS 'COUNT'
FROM pam.IP_FULLTEXT_QUEUE WITH (NOLOCK)
GROUP BY STATUS
ORDER BY 1 ASC
--Count for all Mailboxes + Folders + Mails
SELECT (SELECT COUNT(*) FROM pam.MAILBOX WITH (NOLOCK)) + (SELECT COUNT(*) FROM pam.MAILBOX_FOLDERS WITH (NOLOCK)) + (SELECT COUNT(*) FROM pam.MAILBOX_DOCLINK WITH (NOLOCK))
Action values
If there are manual changes in the database, the corresponding fulltext request has to be inserted in the IP_FULLTEXT table. For this the stored procedure IP_FT_ENQUEUE can be used.
WARNING!
Directly modifying the database is not supported and can lead to data loss or other problems.
The following values are used as ACTION:
- 1 =
Index
A new item (folder or document) should be indexed. Also used if an item is already indexed and should be re-indexed. - 3 =
LogicalDelete
If an existing item should be logically deleted from the index. So if the folder or document is set toDELETED = 1in the database, the corresponding entry in the index must be updated as well. - 4 =
LogicalRestore
If an existing item should be logically restored from the index. So if the folder or document is set toDELETED = 0in the database, the corresponding entry in the index must be updated as well. - 5 =
Delete
To completely remove an item from the index. - 6 =
FormatChange
If a format has been changed that also affects the index, each folder (including sub-folders) on which this format is set must be re-indexed. This action cannot be used byIP_FT_ENQUEUEbecause theACTION_DATAmust be filled as well! - 7 =
AclChange
If the permissions of an existing ACL have changed, each folder (including sub-folders) to which this ACL is assigned must be re-indexed. This action cannot be used byIP_FT_ENQUEUEbecause theACTION_DATAmust be filled as well! - 8 =
DeleteLink
If a share is deleted, the corresponding entry in the index must be deleted as well. This action cannot be used byIP_FT_ENQUEUEbecause theACTION_DATAmust be filled as well! - 9 =
UpdateField
If a field should be searched for and changed to a new value. This action cannot be used byIP_FT_ENQUEUEbecause theACTION_DATAmust be filled as well!
This Enum exists in inPoint.Fulltext.API.IndexAction
Kibana
Index status is Yellow
If the status "Yellow" is displayed for our index in Kibana, it is often due to the "Unassigned Shards".

To fix the Status, open the Kibana Dev Tools Console and execute this command:
PUT */_settings
{
  "index":{
    "number_of_replicas":"0"
  }
}
After this the "Unassigned Shards" are set to 0.
Refresh the Kibana Monitoring Indices page to check if the Status was changed to "Green".

Log in to Kibana is not possible because the license has expired
If Kibana is opened and it is not possible to enter the username and password, the license has expired.
This lines are written in the Elasticsearch log file:
org.elasticsearch.ElasticsearchSecurityException: current license is non-compliant for [security]
or:
… blocking [cluster:monitor/health] operation due to expired license. Cluster health, cluster stats and indices stats operations are blocked on license expiration. All data operations (read and write) continue to work. If you have a new license, please update it. Otherwise, please reach out to your support contact.
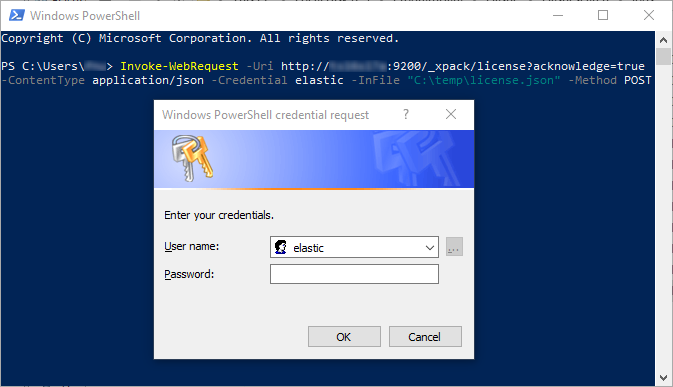
PowerShell can be used to install a new Kibana license (if the Kibana Console cannot be opened):
Invoke-WebRequest -Uri http://<host>:<port>/_xpack/license?acknowledge=true -ContentType application/json -Credential <user> -InFile "<Path to the license.json>" -Method POST
- <host>
The server on which Elasticsearch is running - <port>
The port where Elasticsearch is responding - <user>
Elasticsearch user - <Path to the license.json>
The complete path to the license.json.
Make sure the file is located on the same Computer where the command is executed!
The double quotes in front and behind should remain.
Example:
After the command was executed, a "Windows PowerShell credentials request" window appears in which the password for the Elasticsearch user must be entered.
After clicking on "OK"
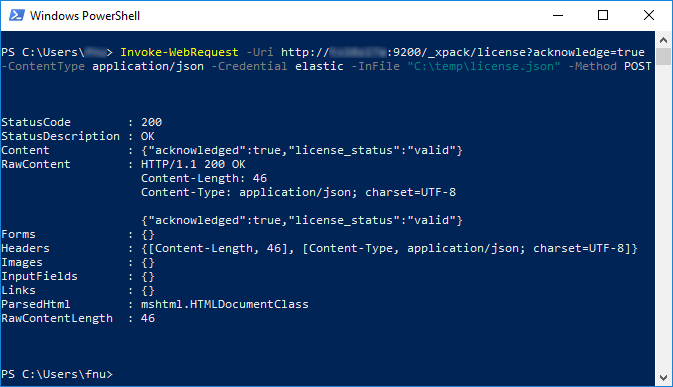
The Content must display: {"acknowledged":true,"license_status":"valid"}
Indexer
Query timeouts in the log file
Check the indexes fragmentation
For the following tables the Indexes should be checked:
- MAILBOX
- MAILBOX_FOLDERS
- MAILBOX_DOCLINK
- PAM_ACLREF
- PAMAU_MAIL_DESC
- PAMAU_MAIL_CONT
Proceed as follows for each table (in Microsoft SQL Server Management Studio):- Search for the table, expand the table and then expand Indexes
- Open the "Properties" window for the first Index
- Select "Fragmentation"
- Read the value for "Total fragmentation"
- Value is < 5% => Do nothing
- Value is between 5% and 30% => Reorganize
- Value is > 30% => Rebuild
- Close the "Properties" window
- Right click the Index and depending in the "Total fragmentation" select "Reorganize" or "Rebuild".
- Repeat step 2-6 for all Indexes on this table.
See: Reorganize and rebuild indexes
Increase connection timeout
- Stop
inPoint.Indexerservice - Copy the
inPoint.Archive.configto the inPoint.Indexer installation directory - Open the copied
inPoint.Archive.configand add;hscommandtimeout=180to the end of theDbConnectionStringvalue.
Example:
Before:After:DbConnectionString="Data Source=datenbanksql;Initial Catalog=inpoint;User Id=testuser;Password={0}"DbConnectionString="Data Source=datenbanksql;Initial Catalog=inpoint;User Id=testuser;Password={0};hscommandtimeout=180" - Open the
inPoint.Indexer.exe.configand paste the complete path for the copiedPam.Archive.configto thePamArchiveConfig ExternalFilevalue. - Start
inPoint.Indexerservice